The Healthy Kids, Healthy Communities ProjectThis project was expanded from a desire to have a community bike trail along Fishing Creek which runs around downtown Milledgeville. The original idea was expanded and demographic work was done to show where the target populace was and their proximity to the trail was. The idea was to offer a way to get around Milledgeville that wouldn't require a car. The goal is to get the community moving to help fight overweight/inactivity in today's youth. The target populace are those at highest risk of obesity, which are typically those of lower income and social status. All the data was downloaded from the U.S. Census bureau. Then, the files were adapted from spreadsheets and analyzed in ArcGIS
|
Population Density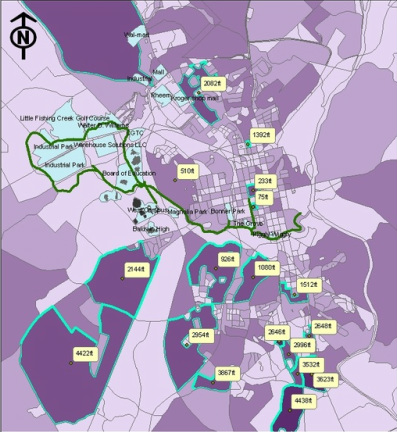
This graphic shows the population densities of the Milledgeville census blocks. Highlighted are the areas of highest density with a center point for each showing distance from the trail (in green).
|
Age and Gender
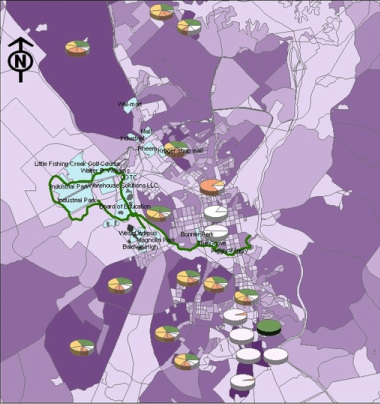
This graphic starts with the same population background but uses pie charts to show the different age ranges and genders of each of the target blocks.
Ethnicity
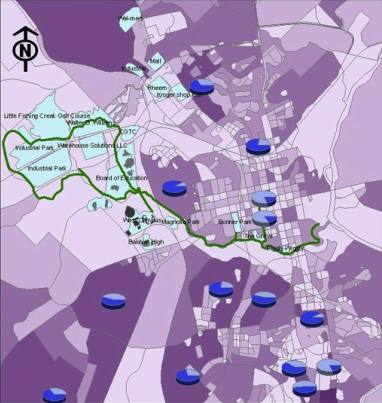
This image was used to analyze the target blocks based on ethnicity (white or black).
